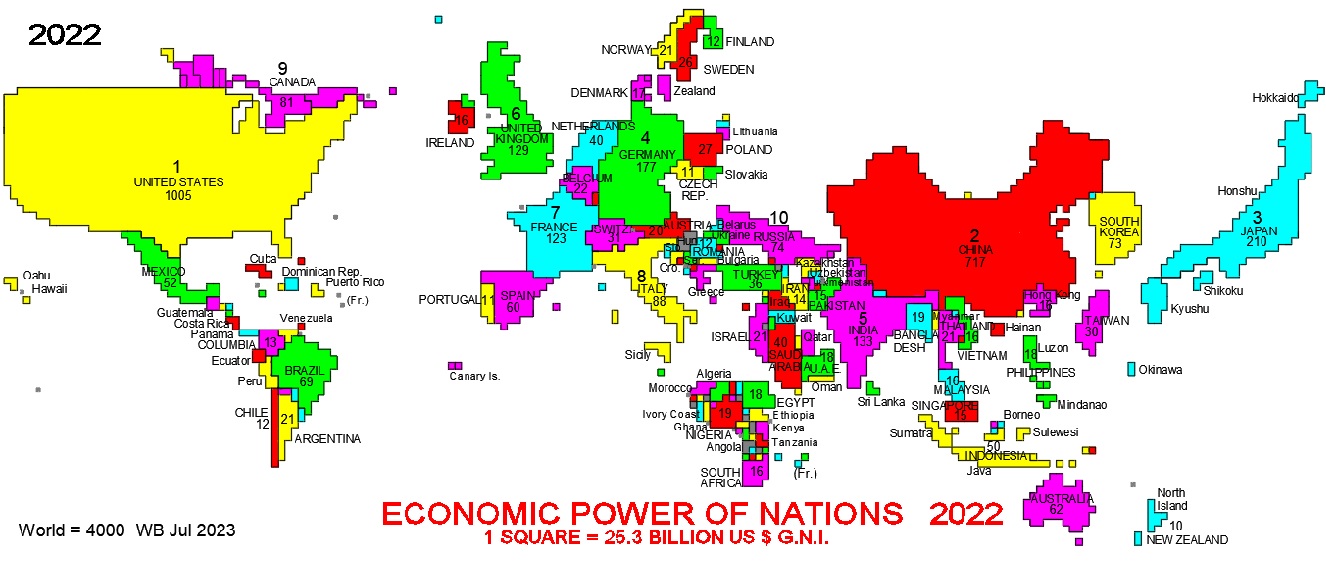
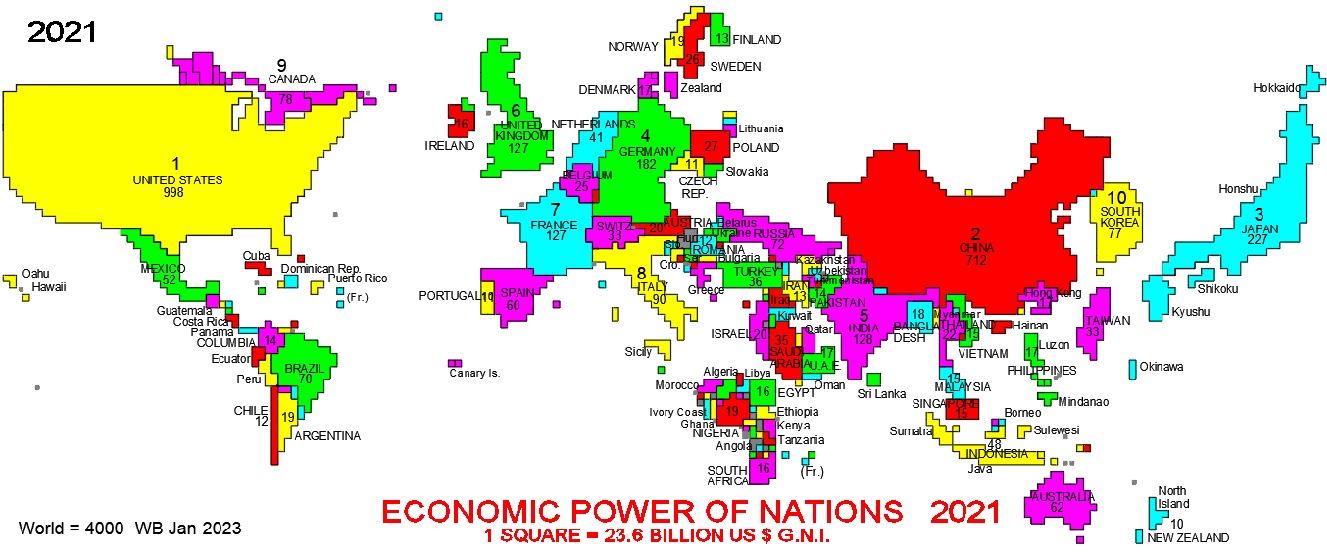
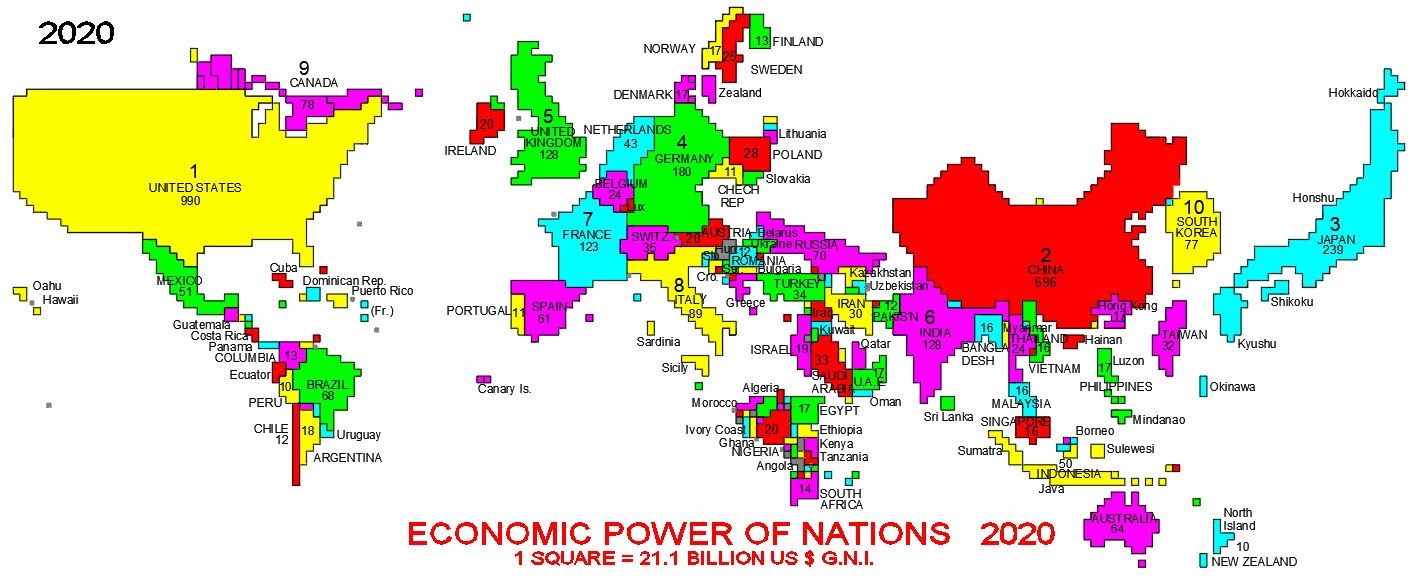
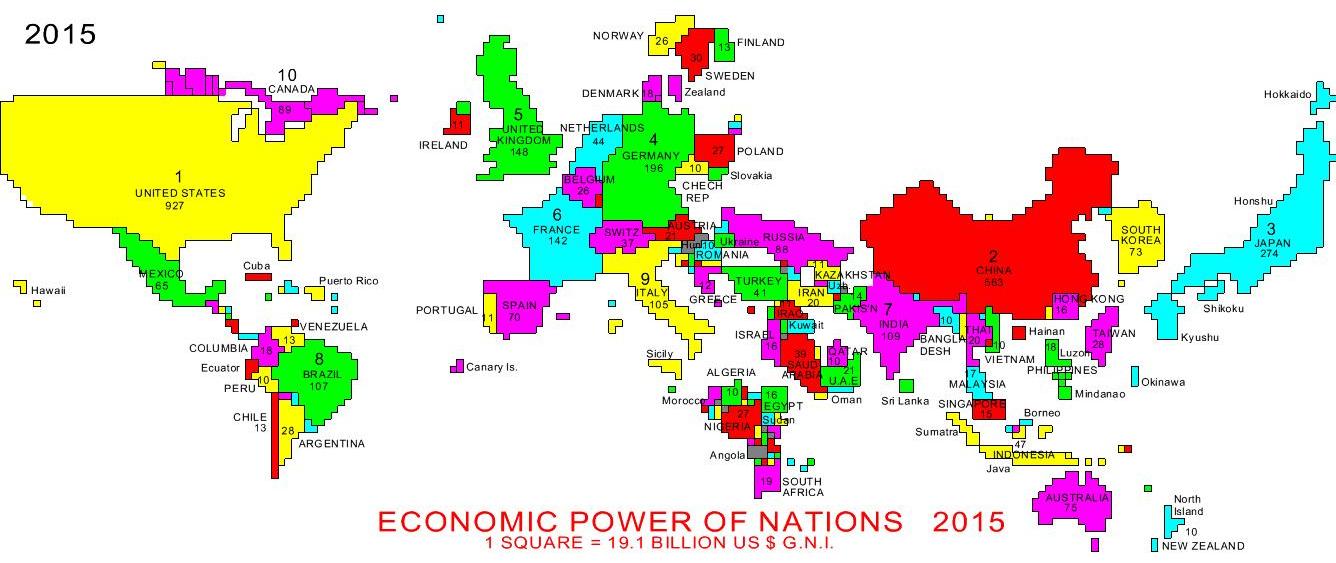
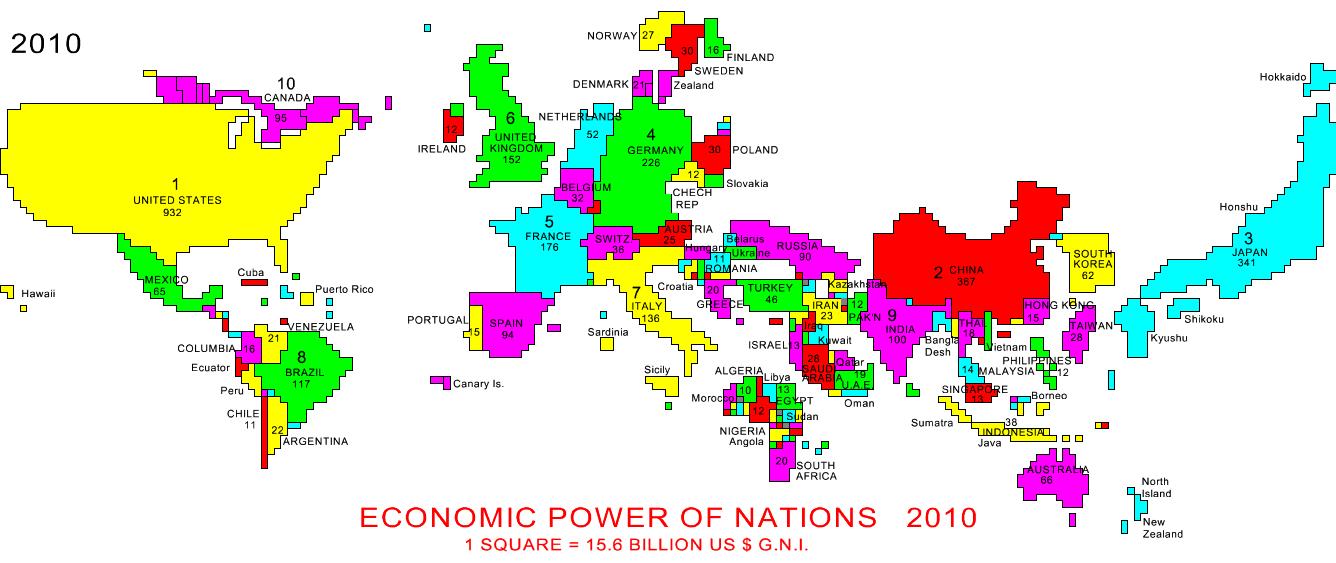
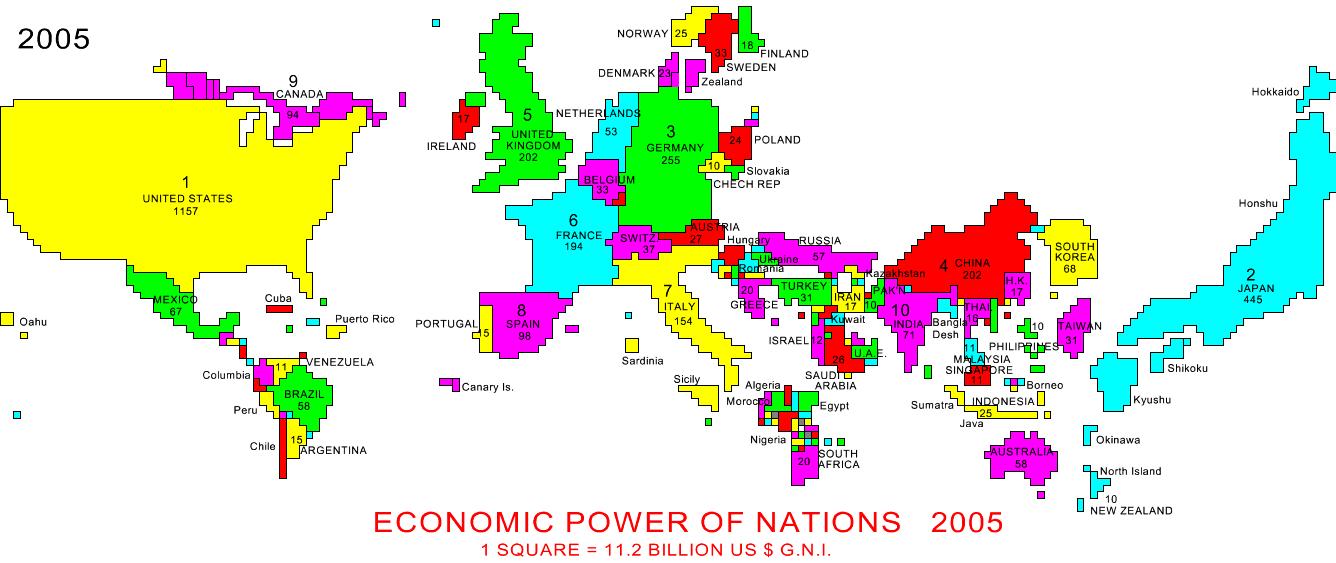
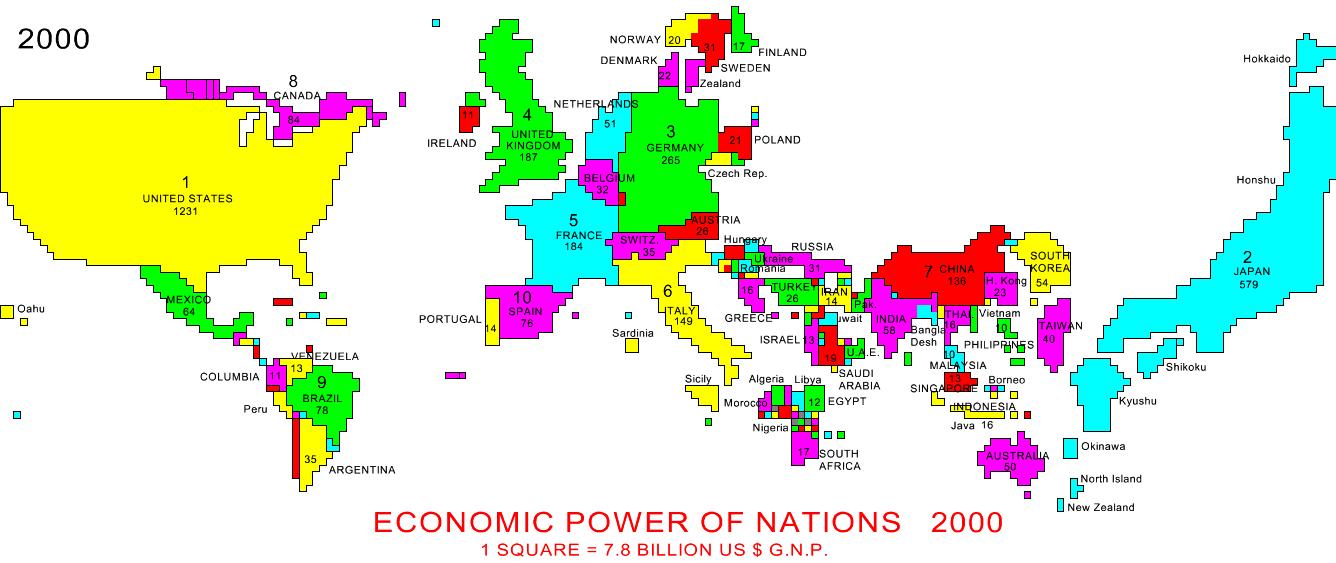
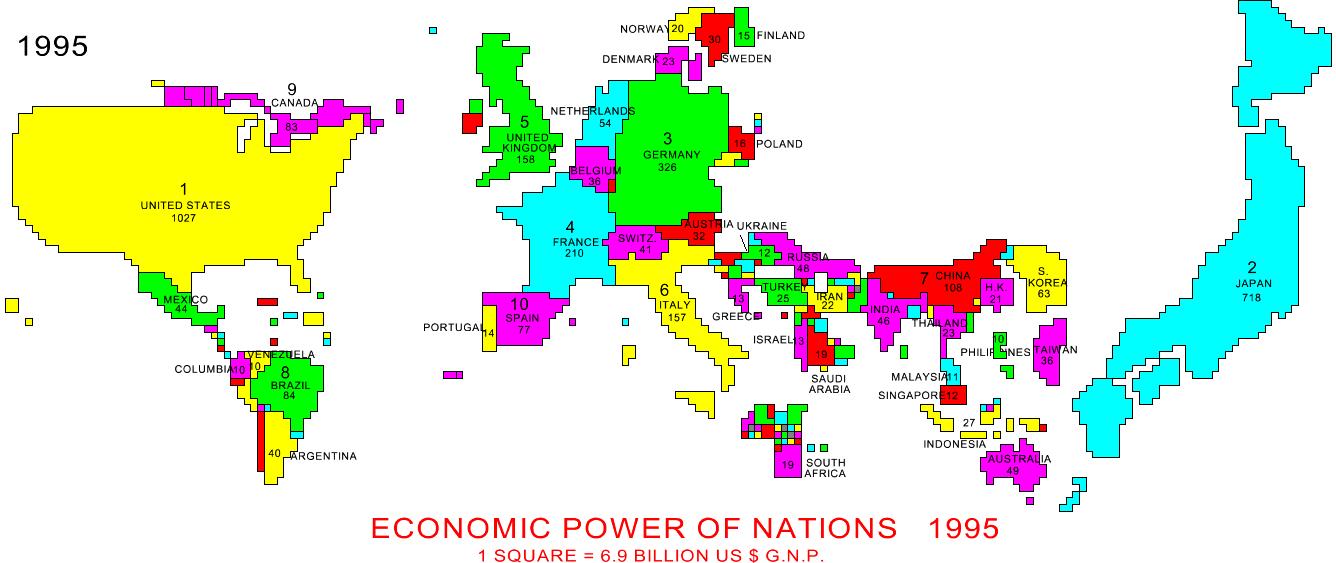
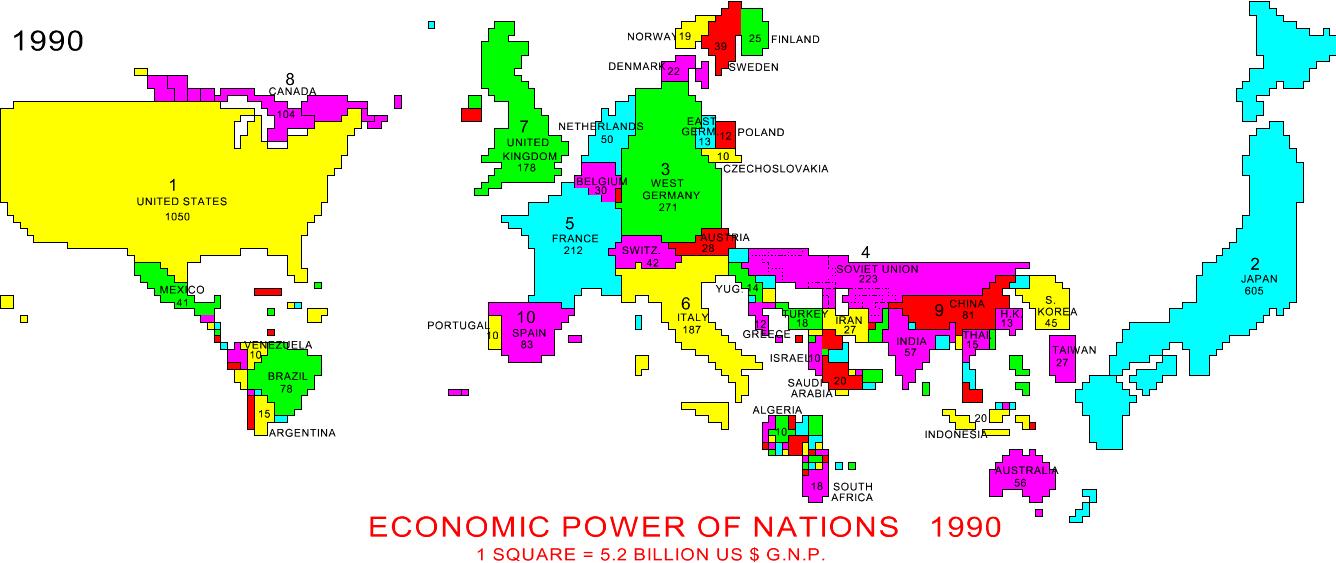
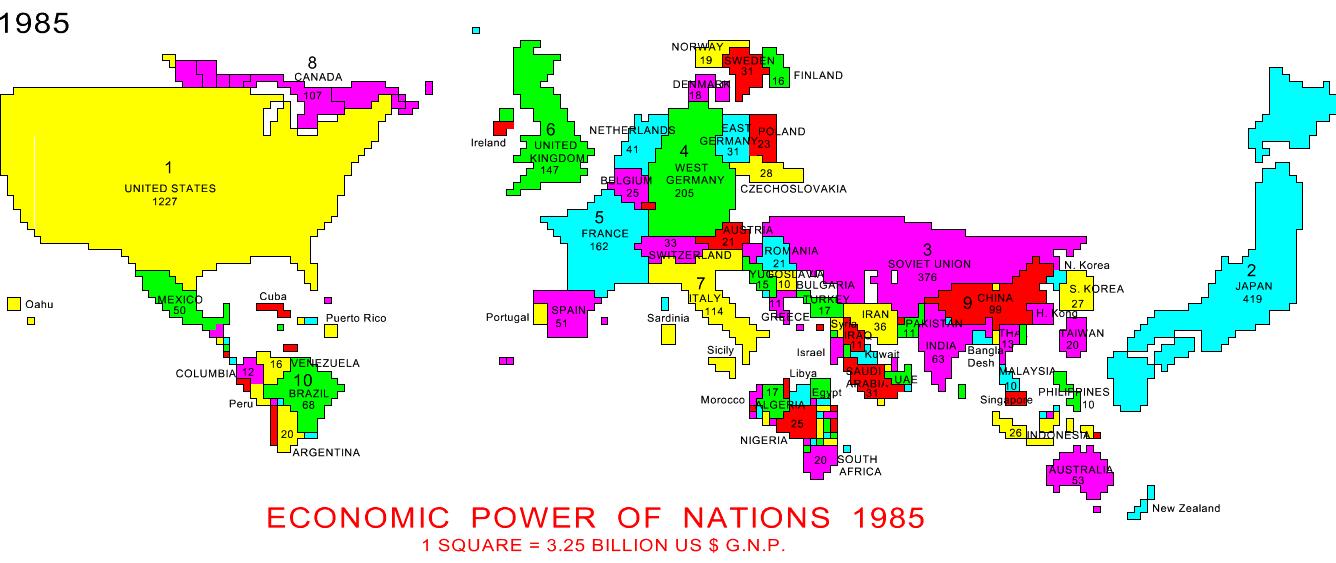
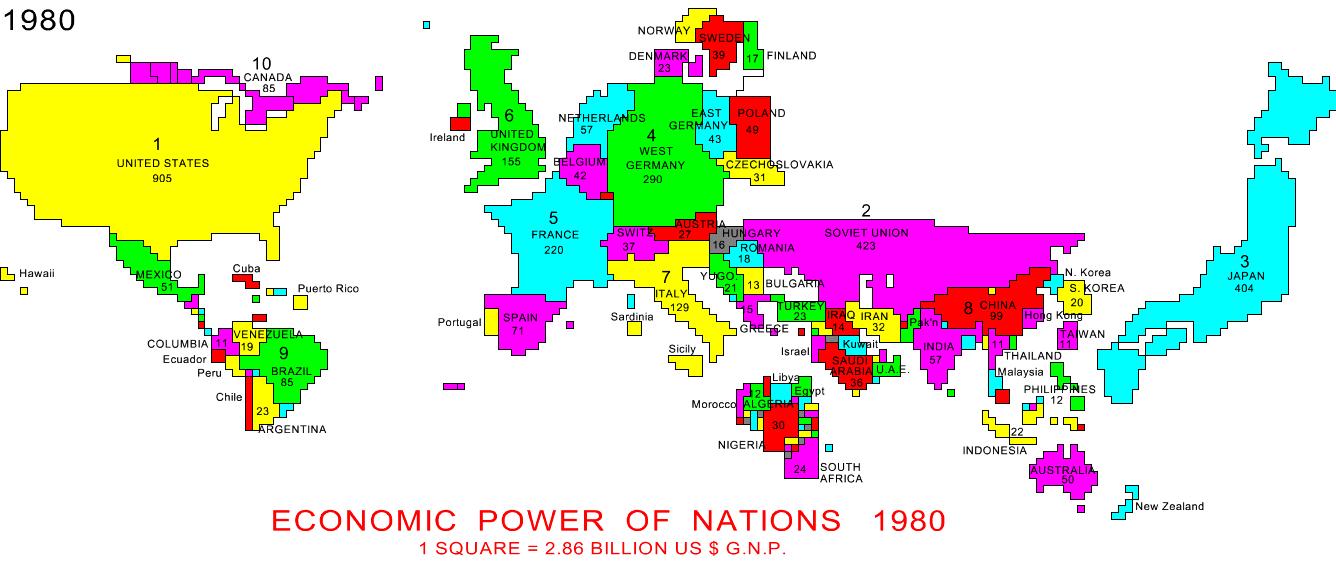
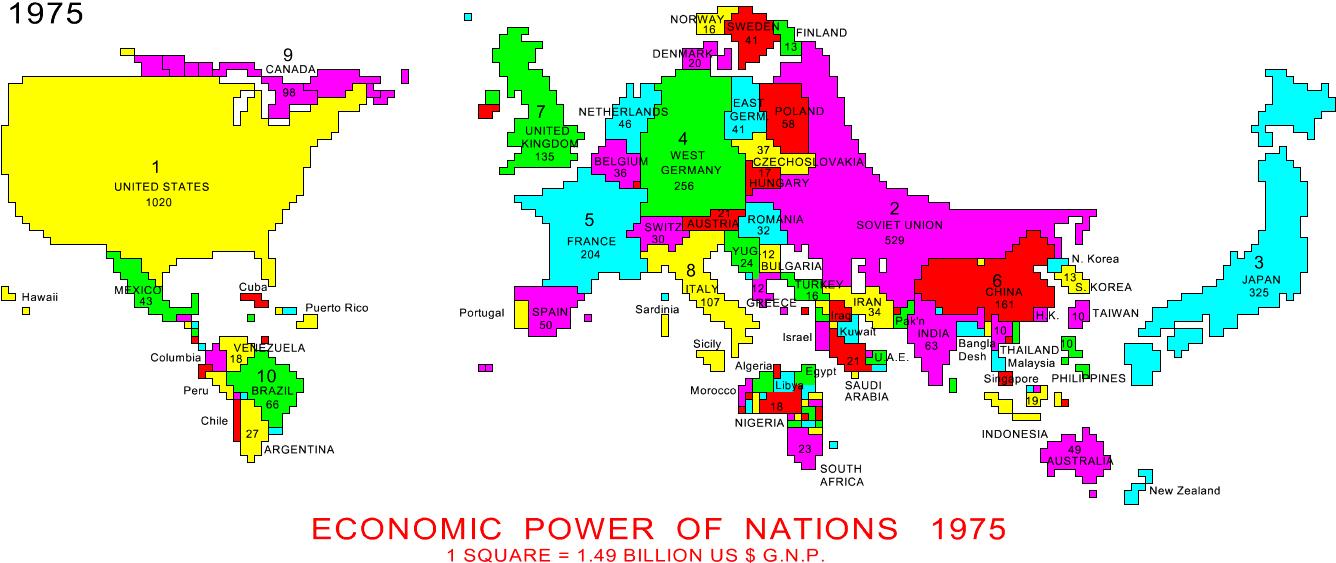
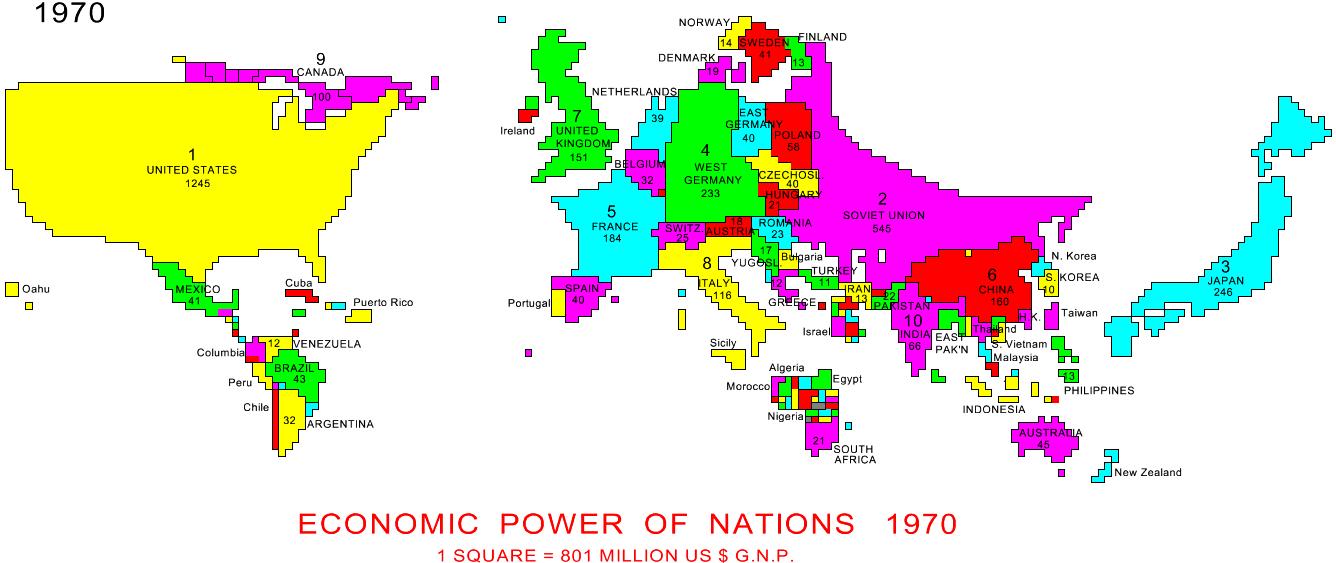
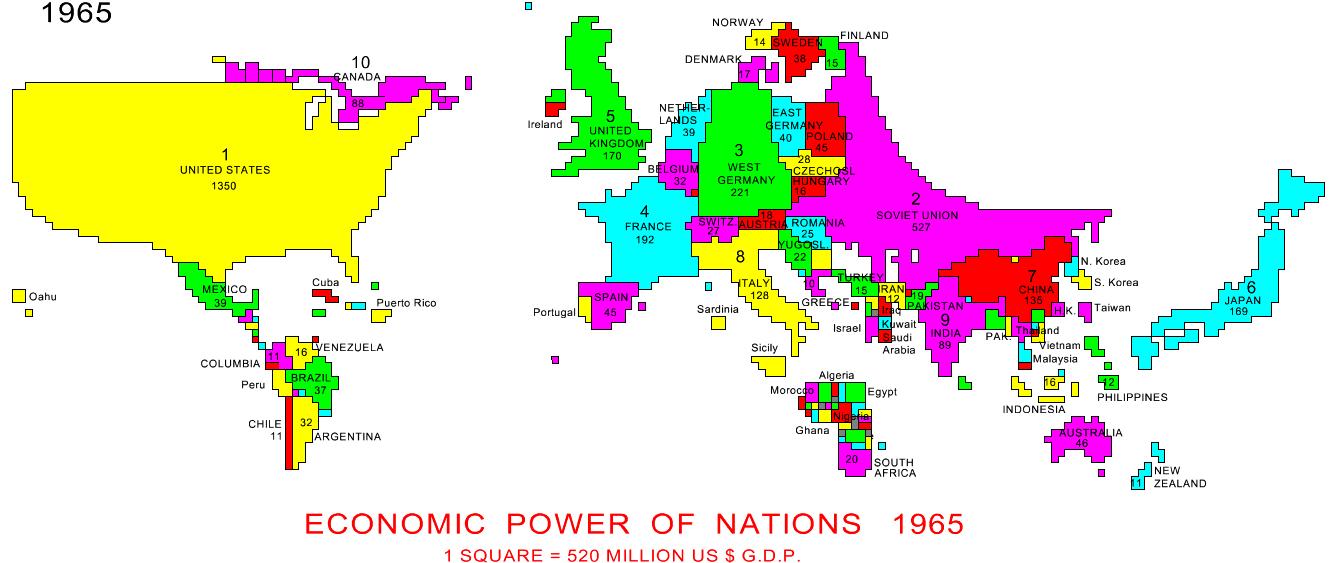
World Economies
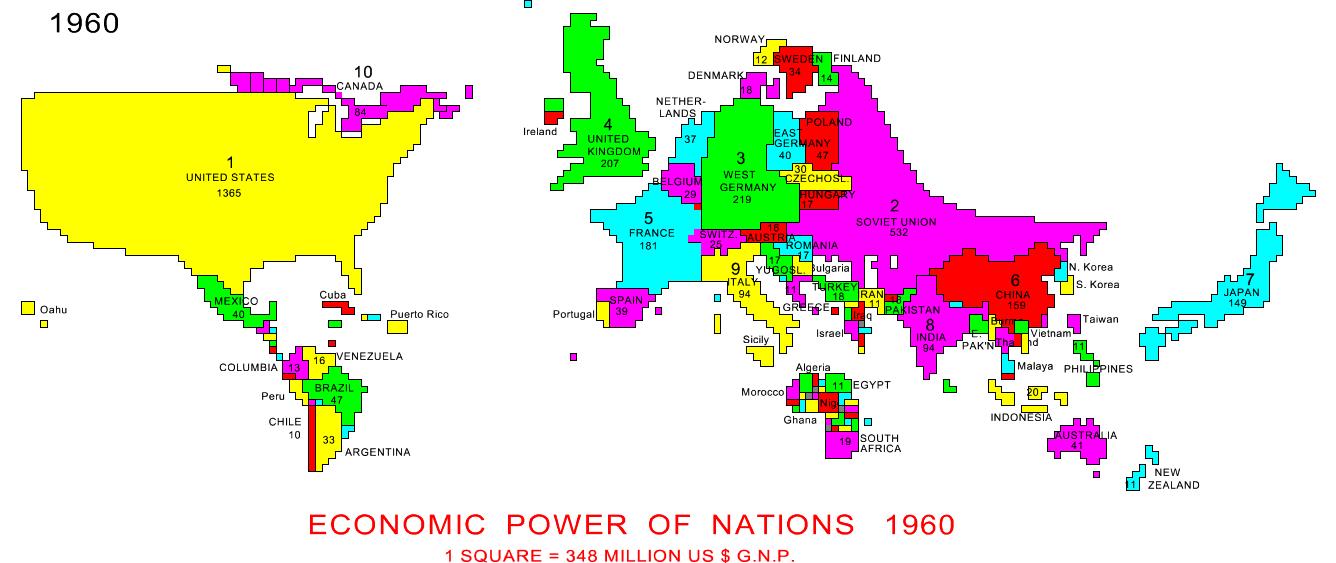
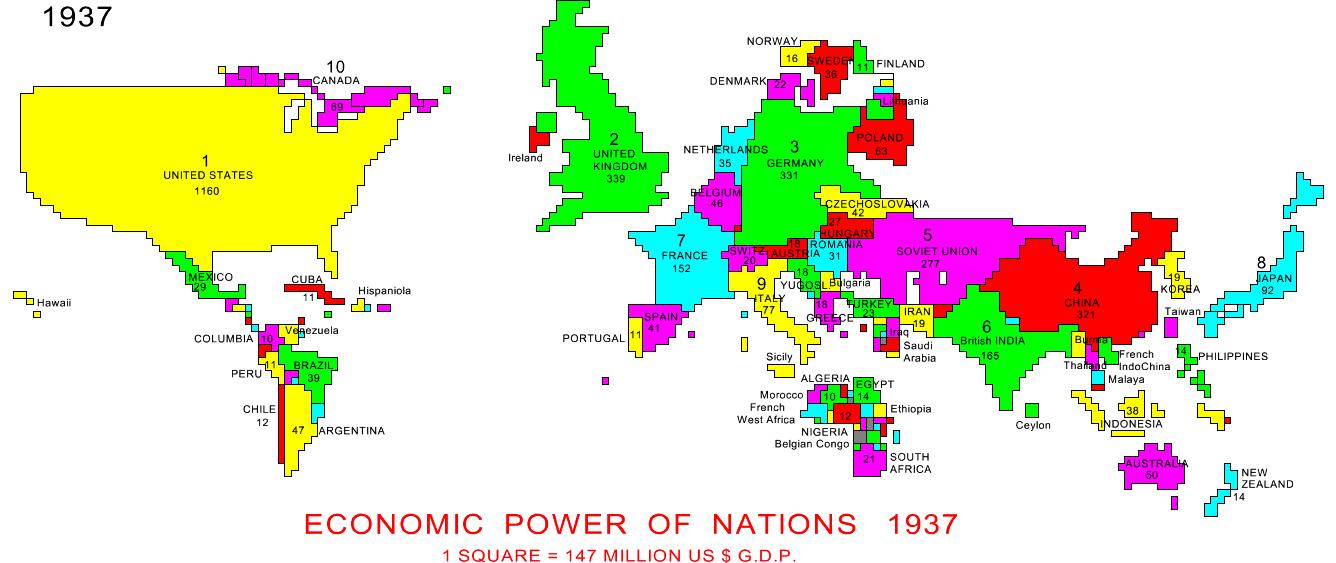
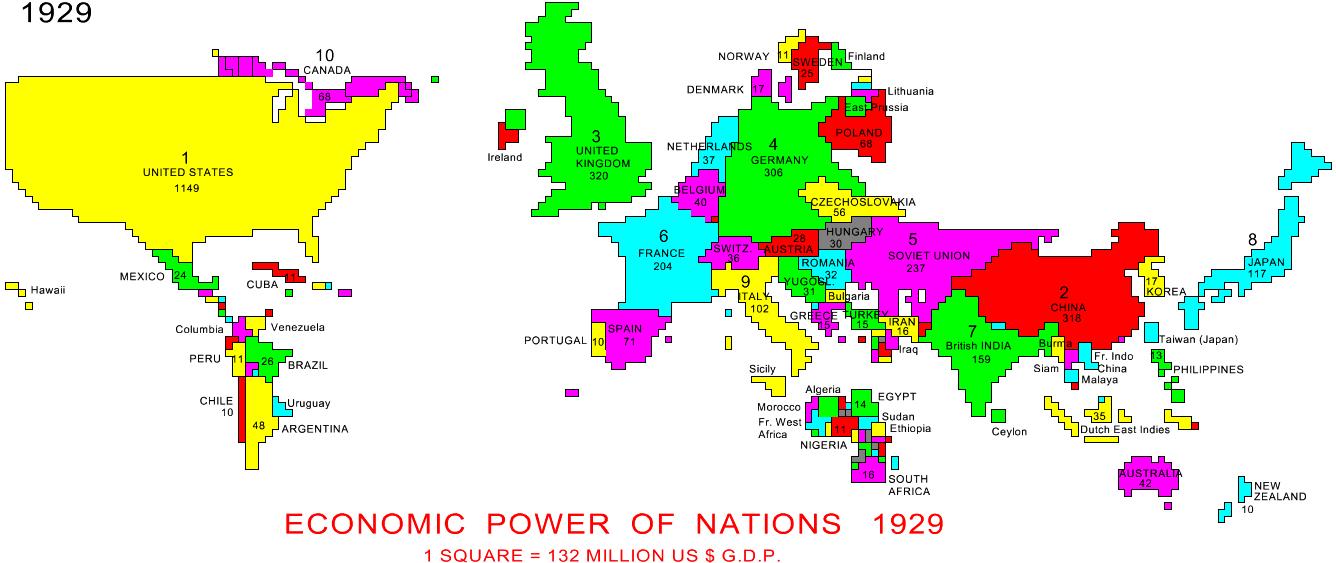
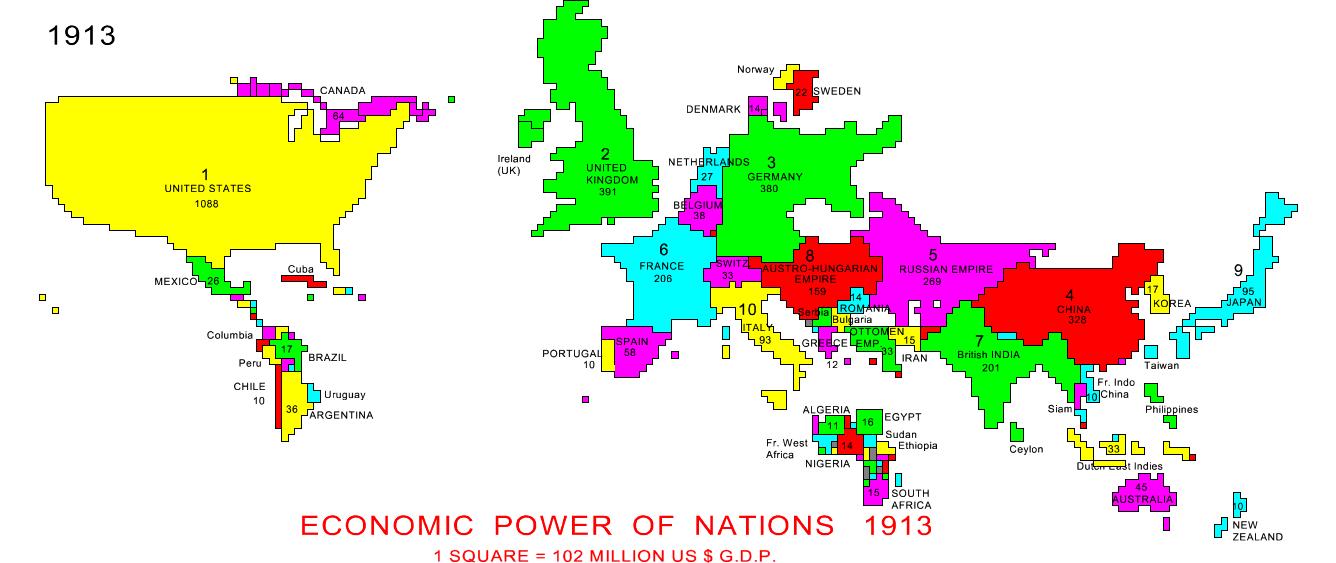
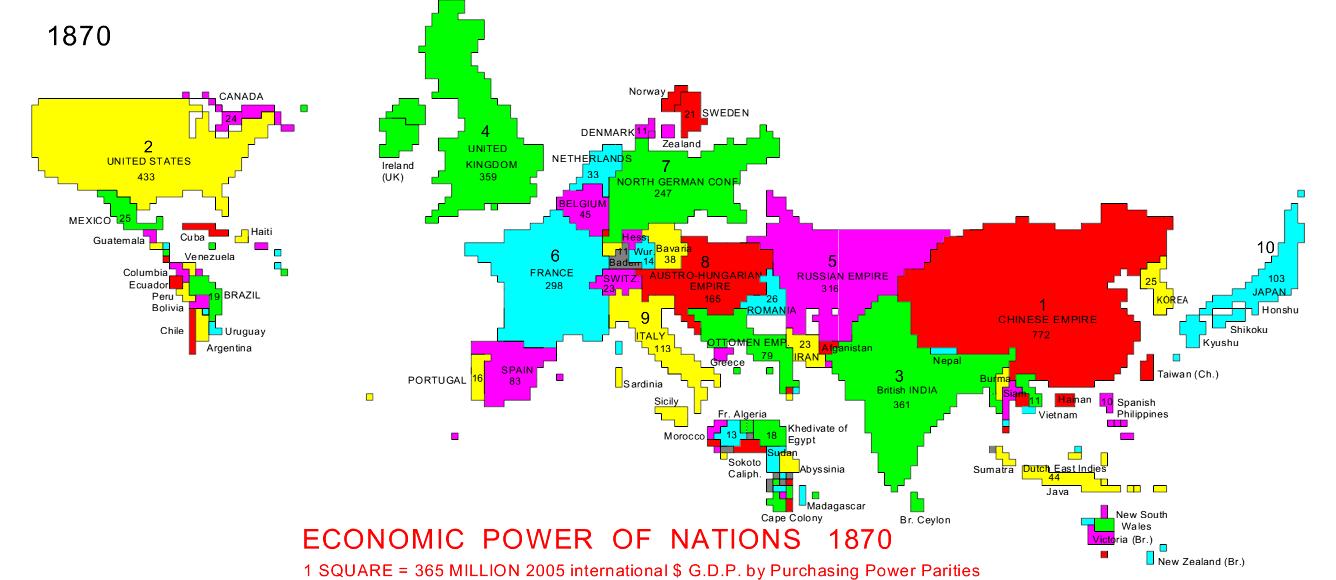
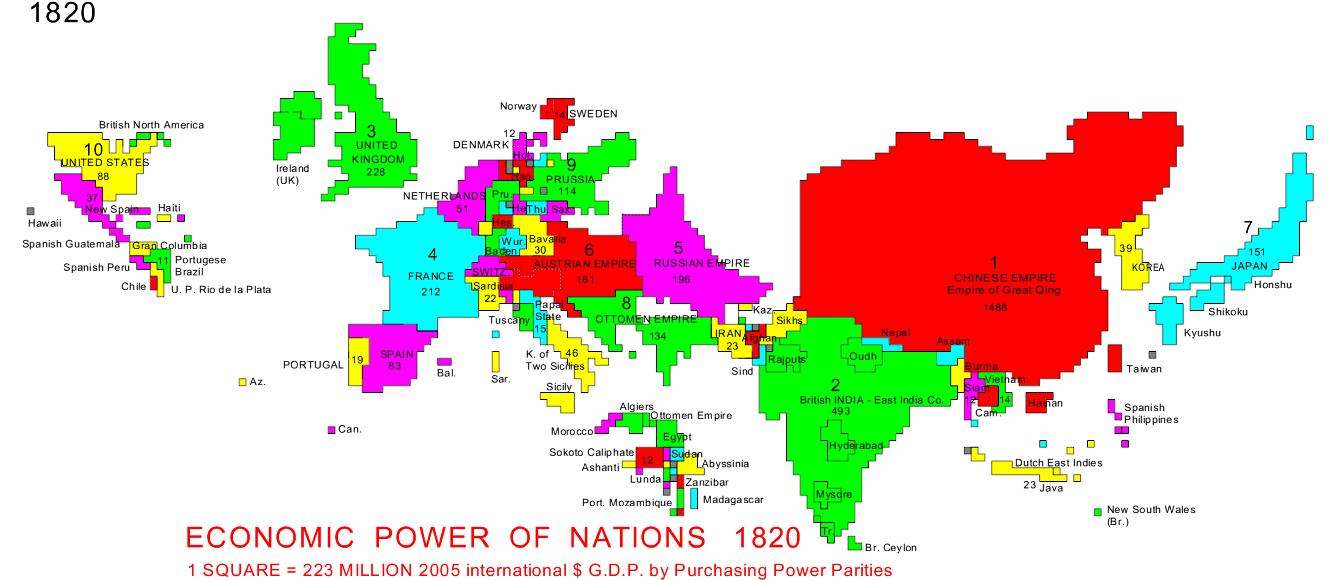
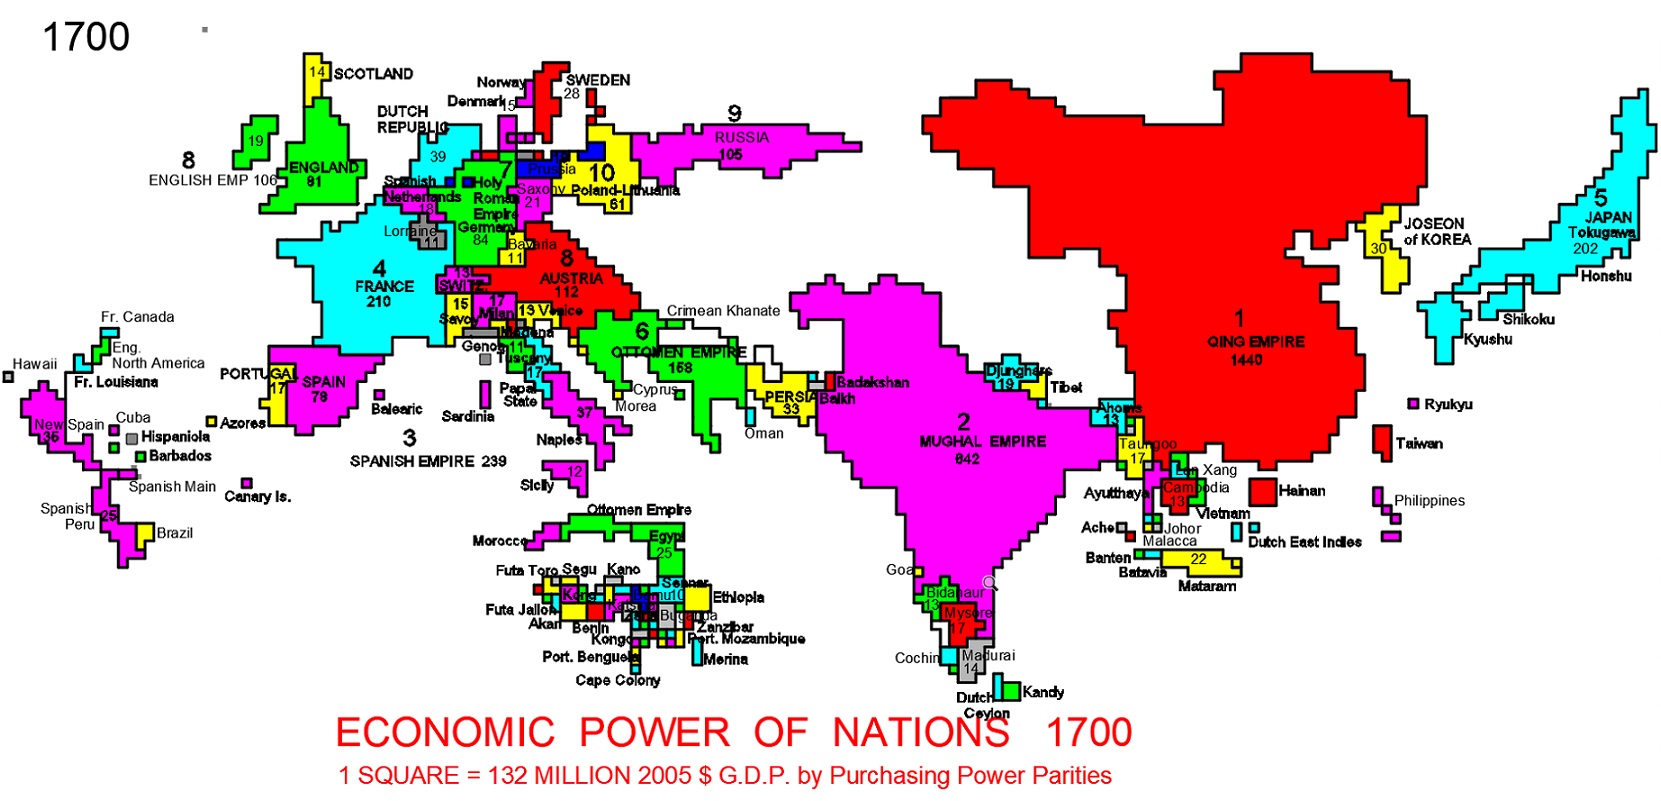
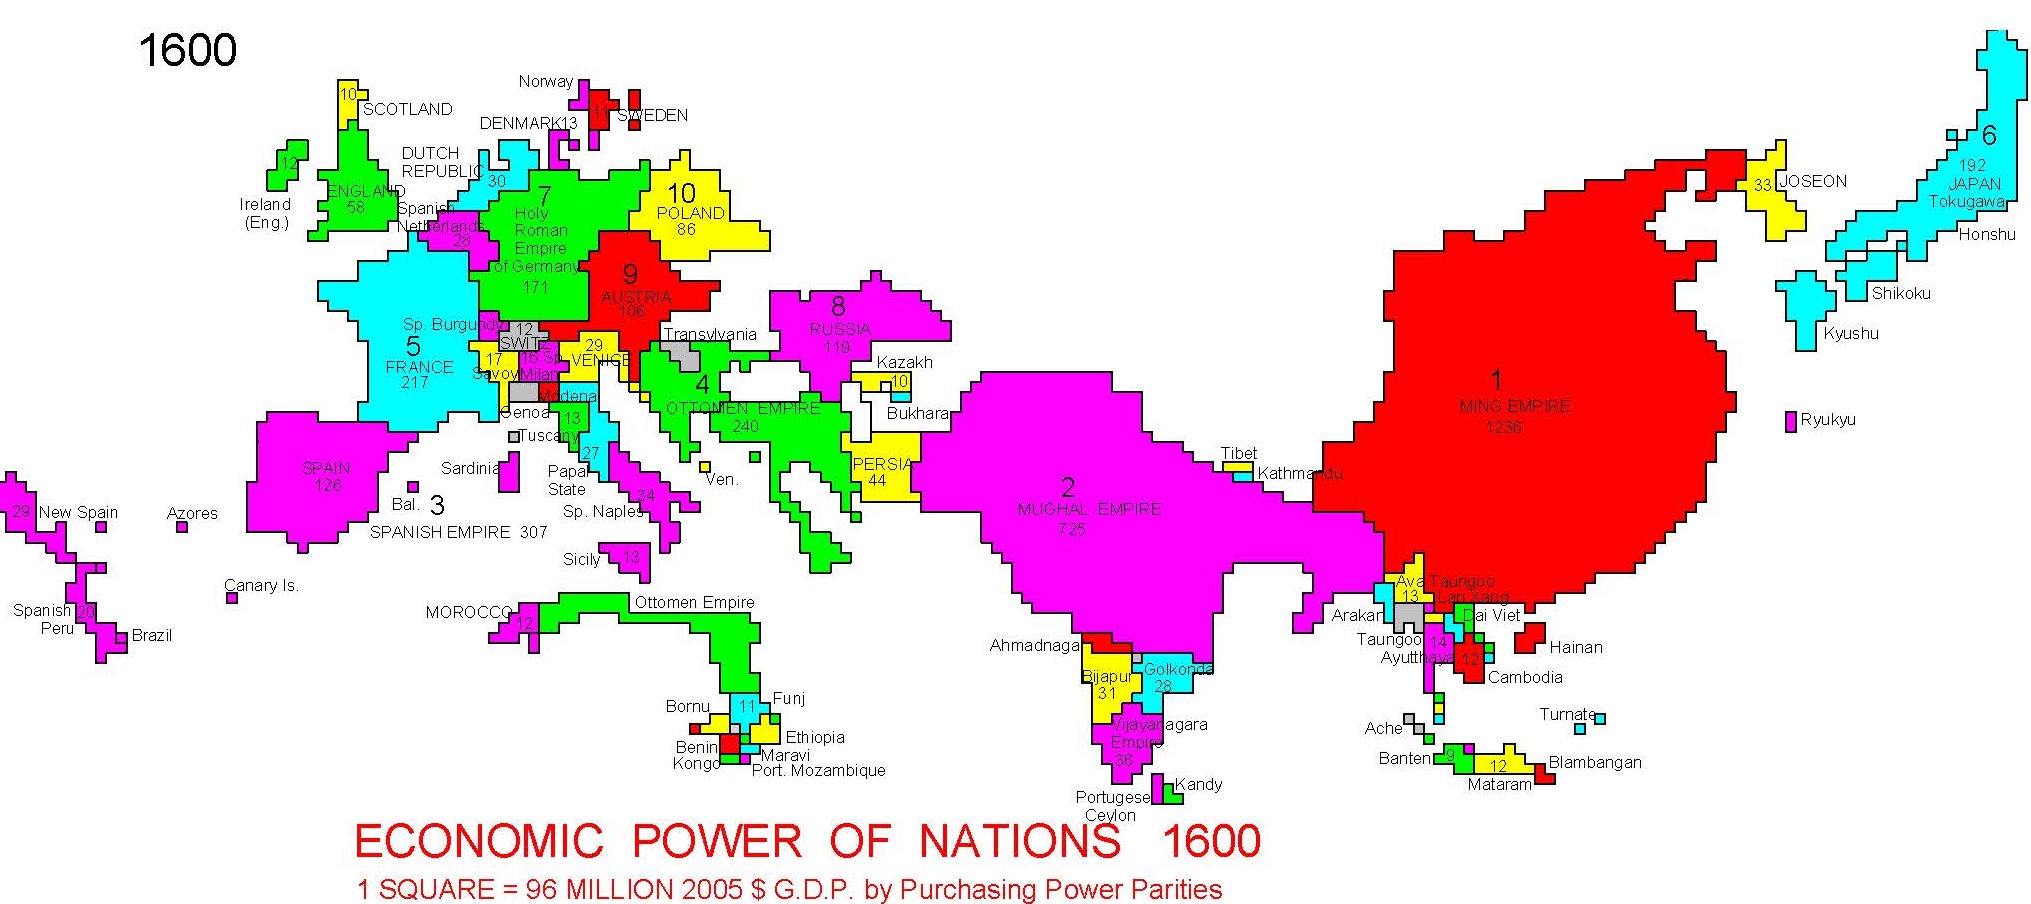
This site shows the Economic Power of Nations with each country drawn in proportion to their gross domestic product based upon average market exchange rates. Each map is drawn at the same scale using 4000 squares. Canadian provinces and other countries' islands are shown in proportion their share of their country's gross domestic products.
Maps were drawn using AutoDesk's AutoSketch and exported to AutoCad drawings, then converted from DWG to view as JPEG images.
I use World Bank development indicators, Atlas method as described in the World Economic Data Sources section.
Click on any of the thumbnail images below to view the drawing.
Hold the "Ctrl" button and roll the mouse wheel to zoom in for a better view.
GDP of All Major Nations
|
GDP of Major Nations
|